Excel add-in · free forever
Real models. Inside Excel.
Clear, powerful, free.
Modelling is one of the best ways to think clearly about a business. It stops being one when the model starts fighting back.
Axmo adds a real modelling layer to the spreadsheet you already use. Formulas refer
to what things are rather than to where they sit — so
Revenue = Quantity * Price is written once, for every shop, product,
month and scenario at the same time. Your model stays a file you own: emailable,
version-controllable, yours forever.
Think about the model, not the thousands of cells underneath it.
Available on Microsoft AppSource. No account, no credit card, no trial expiry. Excel on Windows, Mac, and the web.
Why a modelling tool, when the DIY spreadsheet already works?
Most of the world's financial models are made with spreadsheets, which are in fact a DIY tool.
DIY tools are genuinely excellent — a spreadsheet gives you cells and arithmetic and holds no opinion about what you build with them. However, that generality has a price, and it is easy to miss: you pay it in small instalments.
A spreadsheet does not know that revenue is one thing measured along four axes. It knows there is a number in cell M47. So everything that makes a workbook behave like a model — the layout conventions, the naming discipline, the check rows, the sheets that exist only to hold an intermediate step — is structure you supply and then maintain by hand. It works, because you put the effort in and you are good at it. And it lasts exactly as long as you have the time to enforce it.
When it stops holding, you usually find out in the meeting that mattered. But the breakage is not the real cost. The real cost is the model you have to simplify, or the model you don't build at all, because you already know what creating and maintaining it will cost you.
So here is what a modelling tool gives you instead — and what Axmo gives you without leaving the spreadsheet you already work in. Models you build thinking about the business, not about the thousands of cells underneath it. Models you can still change in a year. Models someone else can read. Models where the answer to "can we also see this by…" is yes.
Everything in both columns below can be done, and that is the point: none of it is beyond a good modeller with enough time. The difference is what each one costs you — to build, to change, and to trust the result.
| In a spreadsheet | In Axmo | |
|---|---|---|
| Aligning data of different shapes Quantity by shop, product, month and scenario. Price by product, month and scenario. Revenue is one times the other. | A lookup for every single value to bring the two together, and then a third block the same size as the first, every cell of it a formula. |
One formula: Revenue = Quantity * Price |
| Adding an axis Next month the business wants it by geography. | Find every block and every formula that should now carry it, rework them by hand, and check that nothing was missed. | Add the dimension, and connect it to the series that need that depth. |
| Aggregation Division, directorate, department — summed here, averaged there, weighted somewhere else. | A set of total formulas at each level for each figure, kept consistent with one another as the structure changes underneath them. | Declared once per series, calculated automatically, and available everywhere afterwards — including inside other formulas. |
| Rolling forward, when the data moves A balance carried from one period to the next, in a model where rows appear and disappear in the middle of the dataset as it develops. |
Formulas pointing at the neighbouring cell, rechecked after every insertion and
deletion — or written with OFFSET so that they survive it.
| Nothing to adjust. The formula names the previous period, not the cell before it. |
| Seeing what depends on what Which series use Revenue, which use a given dimension, what is no longer connected to anything. | Trace precedents, cell by cell, and hope. | The Model Map shows every element of the model and lets you explore, navigate and analyse its relationships. |
| What you maintain An existing full-scope monthly and YTD budget-versus-actual model of a production subdivision with three production sites: 600 series and 172,000 values, half input and half calculated, producing 85 report pages of production and financial performance analysis. | Around 86,000 formulas spread across a hundred worksheets, referring to 86,000 input values and to other sheets for values already calculated. Excel ranges may reduce that, but it is still many thousands of formulas to create and maintain. | 600 series definitions — 300 input and 300 calculated, with one formula per calculated series. |
The model in the last row is a real one — an existing budget-versus-actual model in daily use, not an Axmo demonstration.
Here's what that looks like in a workbook.
See it work
Axmo lets you describe your model as named series and the relationships between them — the same structure whether you are explaining what happened or projecting what will.
You start with input series — say Cash Inflows and Cash Outflows, split by month. You connect a Time dimension to them, and then you can add calculated series:
NetCashFlow = Cash Inflows - Cash Outflows| Jan | Feb | Mar | Apr | |
|---|---|---|---|---|
| Cash Inflows | 320 | 280 | 240 | 300 |
| Cash Outflows | 220 | 260 | 275 | 250 |
| NetCashFlow | +100 | +20 | −35 | +50 |
A balance that refers to itself
Now the part that matters most. Every forecast has a balance that rolls forward: this period's closing balance is last period's close plus this period's flows. Cash, stock, debt, retained earnings — all of it works this way. In Axmo you write exactly that:
Balance = Balance[Month[-1]] + NetCashFlow
Axmo sees that Balance refers to its own previous value, and computes
it period by period:
| BEFORE | Jan | Feb | Mar | Apr | |
|---|---|---|---|---|---|
| NetCashFlow | +100 | +20 | −35 | +50 | |
| Balance | 1 000 | 1 100 | 1 120 | 1 085 | 1 135 |
In Excel you can do this — point at the cell to the left or up, and fill down. It
works, but it holds only as long as nobody inserts, deletes or moves anything. Excel
365 has a better answer: SCAN builds the whole balance column in one
formula, and it survives inserted rows. But it needs the flows not to depend on the
balance — put interest on the balance, or a floor under it, and you are circular
again. And it gives you one column: ask for that balance by country, by product and
by scenario, and you are writing a formula for every combination, with the logic
buried inside a cell where nobody can read it off the grid.
Power Pivot won't help either. Its opening- and closing-balance functions read a balance that is already in your data; they don't project one. A DAX measure cannot refer to its own previous result, so once next period's balance depends on this period's computed value, there is nothing to read and no formula to rewrite it into. In Axmo, previous period is what you wrote — and where you need something else, you just state which element of the dimension you mean.
Roll-forward is at the heart of financial modelling, and it is one of the places where the difference in effort is largest — because here the formula survives the model changing shape around it.
A complete model, from a flat table
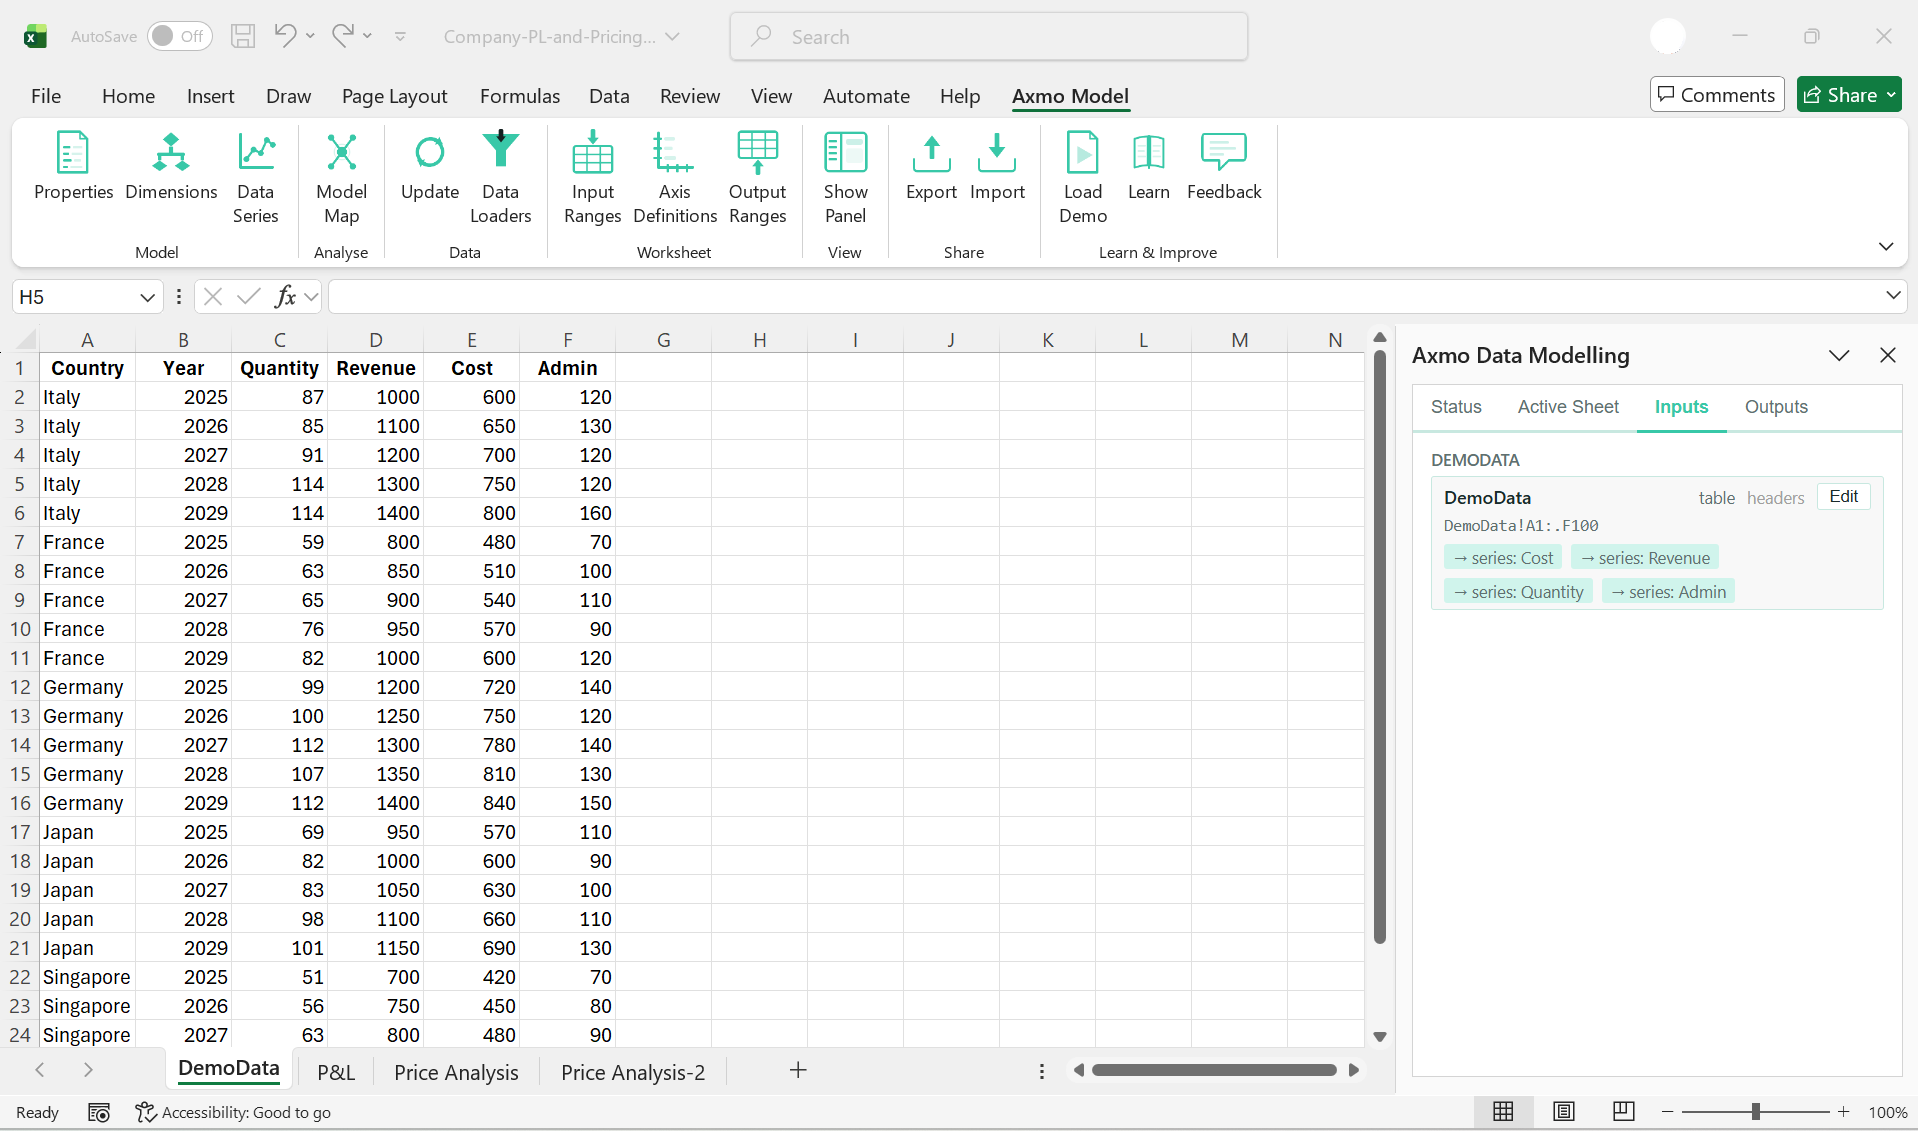
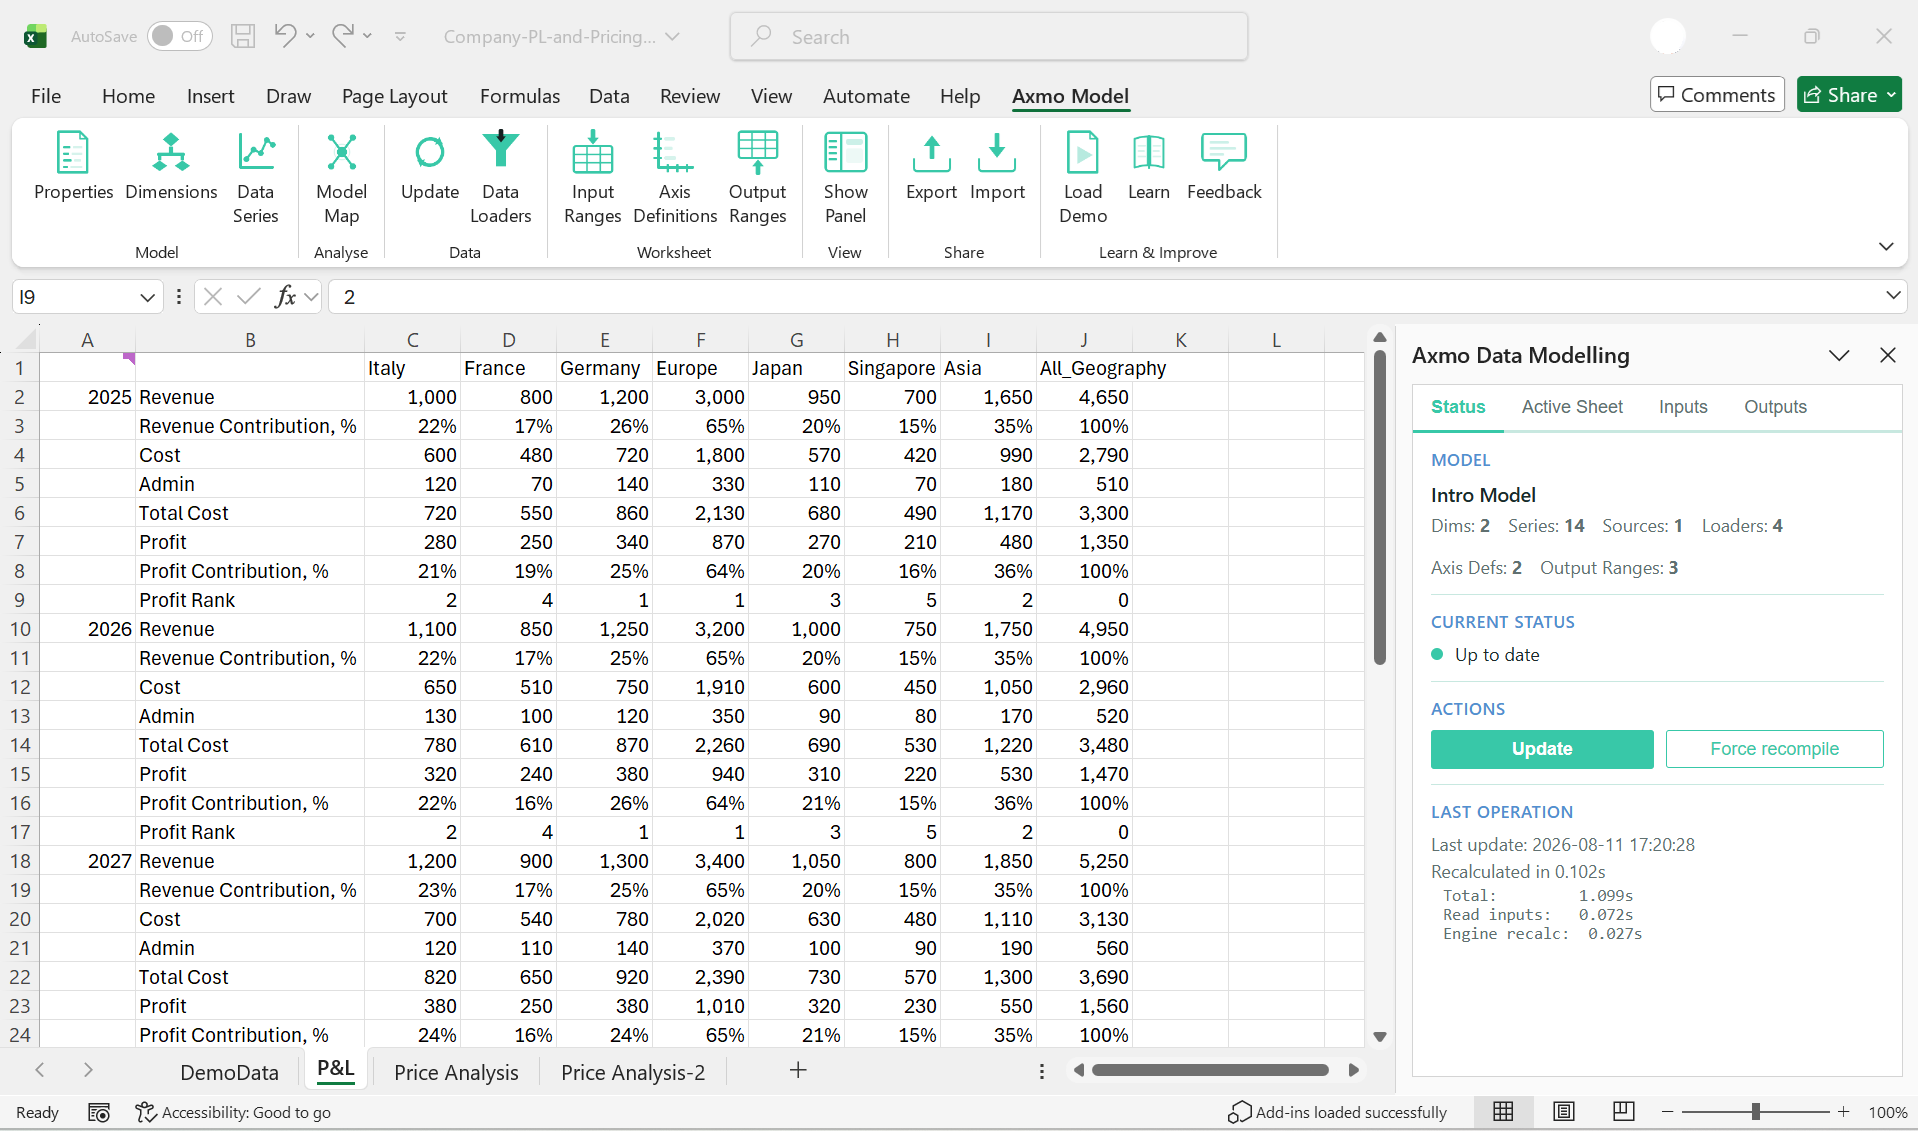
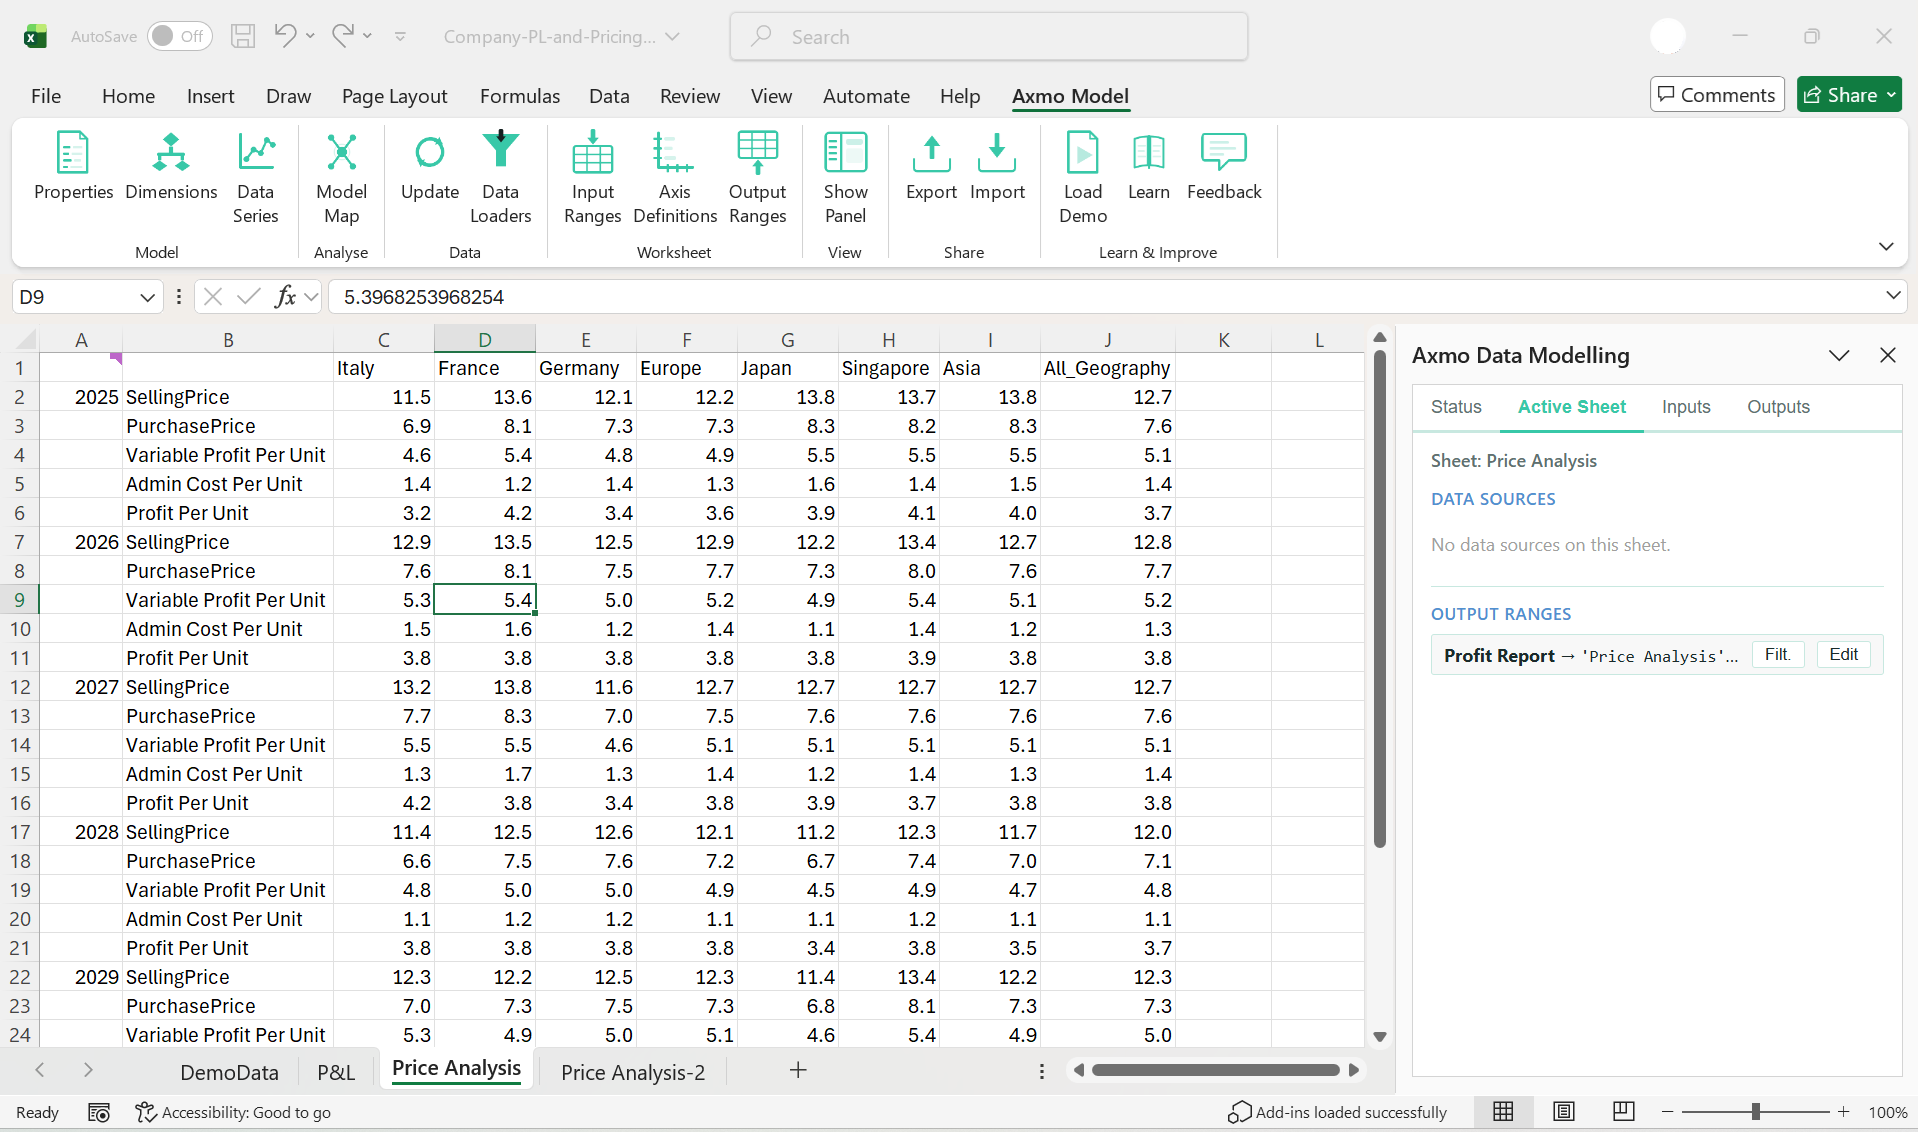
Recurrence is one piece; a real model brings structure too. Axmo's P&L demo starts from a couple dozen rows of raw data — country, year, quantity, revenue, cost and admin — and turns it into a proper model: a P&L by year and country, with contribution percentages, a profit ranking, and regional subtotals rolled up automatically, plus two per-unit price reports.
Click any screenshot to view it full size.
Try it on your own machine
Install the add-in — about two minutes. Then open a new workbook, click Load Demo on the Axmo ribbon, choose the P&L model, and confirm. Change an input, press Update, and watch it recalculate.
Get Axmo freeTwo demo models ship inside Axmo, and they are the start of a set rather than the whole of it: a profit-and-loss model, and the staff budget built from an empty workbook in Build your first model. More are in preparation — cash flow, NPV and IRR, stock and cyclic rolling balances — each a worked example of a different business problem, free to load and pull apart.
Why Axmo
The depth you would expect from a dedicated planning tool, in the workbook you already use — and nothing to procure to get it.
-
Recurrence, built in
Opening balance = last period's close plus this period's flows — debt schedules, cash roll-forwards, retained earnings, interest charged on last period's balance. It's the heart of every forecast. In raw Excel it drives you into circular references — solvable with iterative calculation, at the price of a model that is much harder to check — and Power Pivot can't express it at all, because a DAX measure can't refer to its own result. In Axmo you just write it, and it computes period by period.
-
Structure that survives change
Reference your inputs and results by name, not by cell address. Insert rows, rename periods, add a dimension or new analytical elements — the model holds. This is the modelling layer Excel never had: named dimensions and series, real aggregation, formulas that mean what they say.
-
A file you own
Your model lives inside the workbook — emailable, version-controllable, yours forever, even if we disappear tomorrow. No vendor to be locked into, because there is no vendor holding your model.
-
Nothing to procure
No budget to secure, no implementation project, and no purchase for anyone to sign off. You install it from Excel's own add-in store, and you can start the same afternoon. If your organisation restricts the store, there are two other routes — they are on the install page.
-
Zero migration
Your data and formulas are already in Excel; Axmo adds the modelling layer on top. Point Axmo at a worksheet range or table and it reads from there. Whatever you already use to get data into Excel — Power Query, a SQL Server or Dataverse connection, a paste from your ERP — keeps working exactly as it does now.
-
AI authoring — free when it lands
When AI model authoring arrives, bring-your-own-key will be free and unlimited at every tier, including free, with no quotas. We won't gate AI behind a paid plan. It's in development and we're not publishing a date.
-
Free, and we mean it
Build models, share files, deliver work to clients, teach a class — on the free tier, forever, no credit card. Not a fourteen-day trial wearing a costume.
Who it's for
Axmo is for you if you've felt the gap:
- In-house FP&A who own the budget and forecast — you build and re-run the planning models every cycle, and you've outgrown Excel's fragility but can't justify Anaplan's price or its six-month rollout.
- Consultants and fractional CFOs who need to hand a client a model, not a subscription.
- Analysts whose IT department won't approve another SaaS contract this year.
- Anyone modelling in a regulated, air-gapped, or data-sovereignty-sensitive environment, where "your data on our cloud" is a non-starter.
- Anyone who's opened a multi-tab forecast and thought there has to be a better way to express this.
Why now
The free tier is genuinely free and stays that way: no escalating bill, no renewal to forget, no migration you'll regret signing up for. You're not locking yourself into anything.
And Axmo fills a gap that has been open for years. Excel-native planning is a real, proven category, but reaching it has always meant a budget, a project, and a decision taken somewhere above your head. That is the part that has changed.
What we believe
Serious modelling shouldn't require a big budget or a consultant. Powerful models shouldn't be a privilege reserved for teams who can afford a platform. So we developed Axmo on a few convictions:
- Your model belongs to you. The file is the model; the model is the file. Not ours to hold, not ours to change on you.
- Free should mean free. Core modelling is free at every tier, and AI authoring will be when it arrives — not a funnel that quietly removes the features you actually need.
- The format will be open. The Axmo model format is a documented container — a zip holding a YAML model file and a version marker, with no encryption and no proprietary extensions — and we will publish the specification so other tools can read it. Older versions stay readable permanently.
Try it — the workbook is yours either way
Install the add-in. Load a demo, or build a model in fifteen minutes, and email it to a colleague. No account, no credit card, no trial expiry. If you like it, tell us what's missing. If you don't, the workbook is still yours.
Get Axmo freeReal models. Inside Excel. Free.